Table of Contents
Now the fun begins. The first step to figuring out what is going on in our target program is to gather as much information as we can. Several tools allow us to do this on both platforms. Let's take a look at them.
On Windows as on Linux, several applications will give you varying amounts of information about processes running. However, there is a one stop shop for information on both systems.
The Linux /proc filesystem contains all sorts of interesting information, from where libraries and other sections of the code are mapped, to which files and sockets are open where. The /proc filesystem contains a directory for each currently running process. So, if you started a process whose pid was 1337, you could enter the directory /proc/1337/ to find out almost anything about this currently running process. You can only view process information for processes which you own.
The files in this directory change with each UNIX OS. The interesting ones in Linux are: cmdline -- lists the command line parameters passed to the process cwd -- a link to the current working directory of the process environ -- a list of the environment variables for the process exe -- the link to the process executable fd -- a list of the file descriptors being used by the process maps -- VERY USEFUL. Lists the memory locations in use by this process. These can be viewed directly with gdb to find out various useful things.
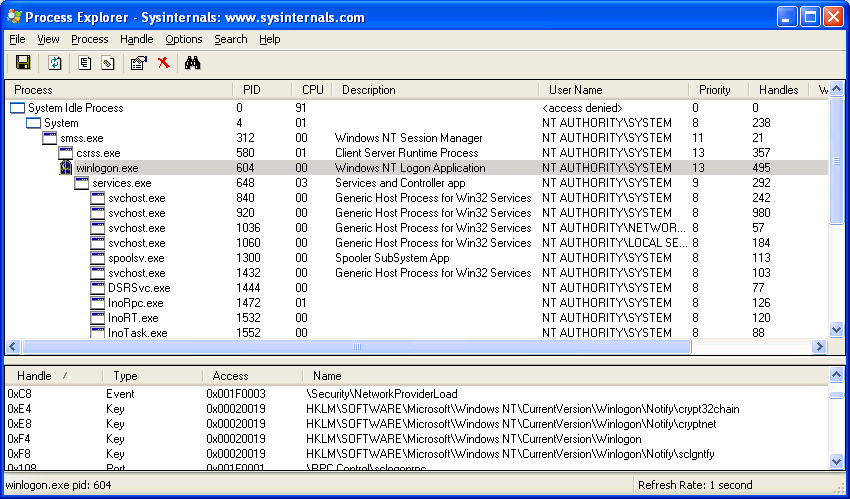
Sysinternals provides an all-around must-have set of utilities. In this case, Process Explorer is the functional equivalent of /proc. It can show you dll mapping information, right down to which functions are at which addresses, as well as process properties, which includes an environment tab, security attributes, what files and objects are open, what the type of objects those handles are for, etc. It will also allow you to modify processes for which you have access to in ways that are not possible in /proc. You can close handles, change permissions, open debug windows, and change process priority.
The first step towards understanding how a program works is to analyze what libraries it is linked against. This can help us immediately make predictions as to the type of program we're dealing with and make some insights into its behavior.
ldd is a basic utility that shows us what libraries a program is linked against, or if its statically linked. It also gives us the addresses that these libraries are mapped into the program's execution space, which can be handy for following function calls in disassembled output (which we will get to shortly).
depends is a utility that comes with the Microsoft SDK, as well as with MS Visual Studio. It will show you quite a bit about the linking information for a program. Not only will list dll's, but it will list which functions in those DLL's are being imported (used) by the current executable, and how they are imported, and then do this recursively for all dll's linked against the executable.
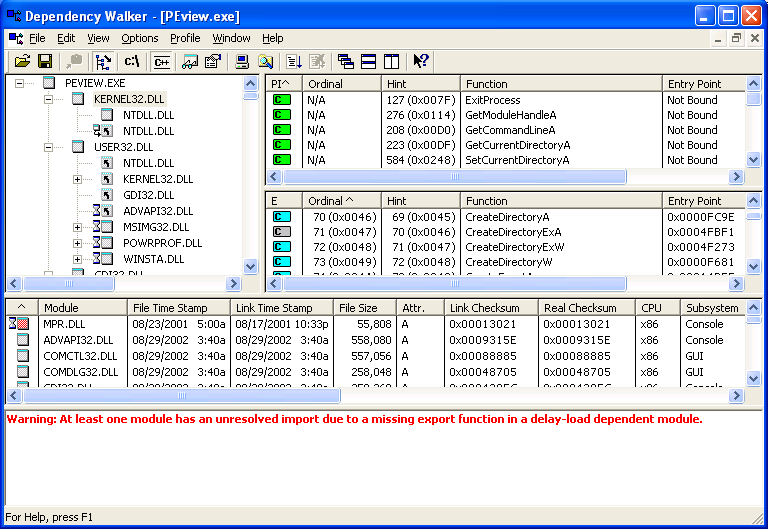
The layout is a little bit much to process at first. When you click on a DLL, you get the functions from this DLL imported by its parent in the tree (upper right, in green). You also get a list of all the functions that this DLL exports. Those that also present in the imports pane are light blue with a dark blue dot. Those that are called somewhere in the entire linked maze are blue, and those that aren't used at all are grey. Most often all that is used to determine the location of the function is a string and/or an ordinal number, which specifies the numeric index of this function in the export table. Sometimes, the function will be "bound", which means that the linker took a guess at it's location in memory and filled it in. Note that bindings may be rejected as "stale", however, so modifiying this value in the executable won't always give you the results you suspect. We will discuss this more in the code modification and interception sections.
The next step in reverse engineering is the ability to differentiate functional blocks in programs. Unfortunately, this can prove to be quite difficult if you aren't lucky enough to have debug information enabled. We'll discuss some of those techniques later.
nm lists all of the local and library functions, global variables, and their addresses in the binary. However, it will not work on binaries that have been stripped with strip.
Unfortunately, the closest thing Windows has to nm is dumpbin.exe, which isn't very great. The only thing it can do is essentially what depends already does: that is list functions used by this binary (dumpbin /imports), and list functions provided by this binary (dumpbin /exports). The only way a binary can export a function (and thus the only way the function is visible) is if that function has the __declspec( dllexport ) tag next to it's prototype (FIXME: Verify).
Luckily, depends is so overkill, it often provides us with more than the information we need to get the job done. Furthermore, the cygwin port of objdump also gets the job done a lot of the time. We discuss objdump in Chapter 5.
lsof is a program that lists all open files by the processes running on a system. An open file may be a regular file, a directory, a block special file, a character special file, an executing text reference, a library, a stream or a network file (Internet socket, NFS file or UNIX domain socket). It has plenty of options, but in its default mode it gives an extensive listing of the opened files. lsof does not come installed by default with most of the flavors of Linux/UNIX, so you may need to install it by yourself. On some distributions lsof installs in /usr/sbin which by default is not in your path and you will have to add it. An example output would be:
COMMAND     PID  USER   FD   TYPE     DEVICE     SIZE       NODE NAME
bash        101 nasko  cwd    DIR        3,2     4096    1172699 /home/nasko
bash        101 nasko  rtd    DIR        3,2     4096          2 /
bash        101 nasko  txt    REG        3,2   518140    1204132 /bin/bash
bash        101 nasko  mem    REG        3,2   432647     748736 /lib/ld-2.2.3.so
bash        101 nasko  mem    REG        3,2    14831    1399832 /lib/libtermcap.so.2.0.8
bash        101 nasko  mem    REG        3,2    72701     748743 /lib/libdl-2.2.3.so
bash        101 nasko  mem    REG        3,2  4783716     748741 /lib/libc-2.2.3.so
bash        101 nasko  mem    REG        3,2   249120     748742 /lib/libnss_compat-2.2.3.so
bash        101 nasko  mem    REG        3,2   357644     748746 /lib/libnsl-2.2.3.so
bash        101 nasko    0u   CHR        4,5              260596 /dev/tty5
bash        101 nasko    1u   CHR        4,5              260596 /dev/tty5
bash        101 nasko    2u   CHR        4,5              260596 /dev/tty5
bash        101 nasko  255u   CHR        4,5              260596 /dev/tty5
screen      379 nasko  cwd    DIR        3,2     4096    1172699 /home/nasko
screen      379 nasko  rtd    DIR        3,2     4096          2 /
screen      379 nasko  txt    REG        3,2   250336     358394 /usr/bin/screen-3.9.9
screen      379 nasko  mem    REG        3,2   432647     748736 /lib/ld-2.2.3.so
screen      379 nasko  mem    REG        3,2   357644     748746 /lib/libnsl-2.2.3.so
screen      379 nasko    0r   CHR        1,3              260468 /dev/null
screen      379 nasko    1w   CHR        1,3              260468 /dev/null
screen      379 nasko    2w   CHR        1,3              260468 /dev/null
screen      379 nasko    3r  FIFO        3,2             1334324 /home/nasko/.screen/379.pts-6.slack
startx      729 nasko  cwd    DIR        3,2     4096    1172699 /home/nasko
startx      729 nasko  rtd    DIR        3,2     4096          2 /
startx      729 nasko  txt    REG        3,2   518140    1204132 /bin/bash
ksmserver   794 nasko    3u  unix 0xc8d36580              346900 socket
ksmserver   794 nasko    4r  FIFO        0,6              346902 pipe
ksmserver   794 nasko    5w  FIFO        0,6              346902 pipe
ksmserver   794 nasko    6u  unix 0xd4c83200              346903 socket
ksmserver   794 nasko    7u  unix 0xd4c83540              346905 /tmp/.ICE-unix/794
mozilla-b  5594 nasko  144u  sock        0,0              639105 can't identify protocol
mozilla-b  5594 nasko  146u  unix 0xd18ec3e0              639134 socket
mozilla-b  5594 nasko  147u  sock        0,0              639135 can't identify protocol
mozilla-b  5594 nasko  150u  unix 0xd18ed420              639151 socket
Here is brief explanation of some of the abbreviations lsof uses in its output:
   cwd  current working directory
   mem  memory-mapped file
   pd   parent directory
   rtd  root directory
   txt  program text (code and data)
   CHR  for a character special file
   sock for a socket of unknown domain
   unix for a UNIX domain socket
   DIR  for a directory
   FIFO for a FIFO special file
It is pretty handy tool when it comes to investigating program behavior. lsof reveals plenty of information about what the process is doing under the surface.
![[Tip]](images/tip.png) | fuser |
|---|---|
A command closely related to lsof is fuser. fuser accepts as a command-line parameter the name of a file or socket. It will return the pid of the process accessing that file or socket. | |
The analog to lsof in the windows world is the Sysinternals Filemon utility. It can show not only open files, but reads, writes, and status requests as well. Furthermore, you can filter by specific process and operation type. A very useful tool. (FIXME: This has a Linux version as well).
The registry in Windows is a key part of the system that contains lots of secrets. In order to try and understand how a program works, one definitely should know how the target interacts with the registry. Does it store configuration information, passwords, any useful information, and so on. Regmon from Sysinternals lets you monitor all or selected registry activity in real time. Definitely a must if you plan to work on any target on Windows.
So this is one of the cases where both Linux and Windows have the same exact name for a utility, and it performs the same exact duty. This utility is netstat.
netstat is handy little tool that is present on all modern operating systems. It is used to display network connections, routing tables, interface statistics, and more.
How can netstat be useful? Let's say we are trying to reverse engineer a program that uses some network communication. A quick look at what netstat displays can give us clues where the program connects and after some investigation maybe why it connects to this host. netstat does not only show TCP/IP connections, but also UNIX domain socket connections which are used in interprocess communication in lots of programs. Here is an example output of it:
Figure 3.3. Netstat output
Active Internet connections (w/o servers)
Proto Recv-Q Send-Q Local Address           Foreign Address         State
tcp        0      0 slack.localnet:58705    egon:ssh                ESTABLISHED
tcp        0      0 slack.localnet:51766    gw.localnet:ssh         ESTABLISHED
tcp        0      0 slack.localnet:51765    gw.localnet:ssh         ESTABLISHED
tcp        0      0 slack.localnet:38980    clortho:ssh             ESTABLISHED
tcp        0      0 slack.localnet:58510    students:ssh            ESTABLISHED
Active UNIX domain sockets (w/o servers)
Proto RefCnt Flags       Type       State         I-Node Path
unix  5      [ ]         DGRAM                    68     /dev/log
unix  3      [ ]         STREAM     CONNECTED     572608 /tmp/.ICE-unix/794
unix  3      [ ]         STREAM     CONNECTED     572607
unix  3      [ ]         STREAM     CONNECTED     572604 /tmp/.X11-unix/X0
unix  3      [ ]         STREAM     CONNECTED     572603
unix  2      [ ]         STREAM                   572488
| NOTE |
|---|---|
The output shown is from Linux system. The Windows output is almost identical. | |
As you can see there is great deal of info shown by netstat. But what is the meaning of it? The output is divided in two parts - Internet connections and UNIX domain sockets as mentioned above. Here is breifly what the Internet portion of netstat output means. The first column shows the protocol being used (tcp, udp, unix) in the particular connection. Receiving and sending queues for it are displayed in the next two columns, followed by the information identifying the connection - source host and port, destination host and port. The last column of the output shows the state of the connection. Since there are several stages in opening and closing TCP connections, this field was included to show if the connection is ESTABLISHED or in some of the other available states. SYN_SENT, TIME_WAIT, LISTEN are the most often seen ones. To see complete list of the available states look in the man page for netstat. FIXME: Describe these states.
Depending on the options being passed to netstat, it is possible to display more info. In particular interesting for us is the -p option (not available on all UNIX systems). This will show us the program that uses the connection shown, which may help us determine the behaviour of our target. Another use of this options is in tracking down spyware programs that may be installed on your system. Showing all the network connection and looking for unknown entries is invaluable tool in discovering programs that you are unaware of that send information to the network. This can be combined with the -a option to show all connections. By default listening sockets are not displayed in netstat. Using the -a we force all to be shown. -n shows numerical IP addesses instead of hostnames.
netstat -p as normal user
(Not all processes could be identified, non-owned process info
 will not be shown, you would have to be root to see it all.)
Active Internet connections (w/o servers)
Proto Recv-Q Send-Q Local Address           Foreign Address         State       PID/Program name
tcp        0      0 slack.localnet:58705    egon:ssh                ESTABLISHED -
tcp        0      0 slack.localnet:58766    winston:www             ESTABLISHED 5587/mozilla-bin
netstat -npa as root user
Active Internet connections (servers and established)
Proto Recv-Q Send-Q Local Address           Foreign Address         State       PID/Program name
tcp        0      0 0.0.0.0:139             0.0.0.0:*               LISTEN      390/smbd
tcp        0      0 0.0.0.0:6000            0.0.0.0:*               LISTEN      737/X
tcp        0      0 0.0.0.0:22              0.0.0.0:*               LISTEN      78/sshd
tcp        0      0 10.0.0.3:58705          128.174.252.100:22      ESTABLISHED 13761/ssh
tcp        0      0 10.0.0.3:51766          10.0.0.1:22             ESTABLISHED 897/ssh
tcp        0      0 10.0.0.3:51765          10.0.0.1:22             ESTABLISHED 896/ssh
tcp        0      0 10.0.0.3:38980          128.174.252.105:22      ESTABLISHED 8272/ssh
tcp        0      0 10.0.0.3:58510          128.174.5.39:22         ESTABLISHED 13716/ssh
So this output shows that mozilla has established a connection with winston for HTTP traffic (since port is www(80)). In the second output we see that the SMB daemon, X server, and ssh daemon listen for incoming connections.
Collecting network data is usually done with a program called sniffer. What the program does is to put your ethernet card into promiscuous mode and gather all the information that it sees. What is a promiscuous mode? Ethernet is a broadcast media. All computers broadcast their messages on the wire and anyone can see those messages. Each network interface card (NIC), as a hardcoded physical address called MAC (Media Access Control) address, which is used in the Ethernet protocol. When sending data over the wire, the OS specifies the destination of the data and only the NIC with the destination MAC address will actually process the data. All other NICs will disregard the data coming on the wire. When in promiscuous mode, the card picks up all the data that it sees and sends it to the OS. In this case you can see all the data that is flowing on your local network segment.
| Disclaimer |
|---|---|
Switched networks eliminate the broadcast to all machines, but sniffing traffic is still possible using certain techniques like ARP poisoning. (FIXME: link with section on ARP poisoning if we have one.) | |
Several popular sniffing programs exist, which differ in user interface and capabilities, but any one of them will do the job. Here are some good tools that we use on a daily basis:
ethereal - one of the best sniffers out there. It has a graphical interface built with the GTK library. It is not just a sniffer, but also a protocol analyzer. It breaks down the captured data into pieces, showing the meaning of each piece (for example TCP flags like SYN or ACK, or even kerberos or NTLM headers). Furthermore, it has excellent packet filtering mechanisms, and can save captures of network traffic that match a filter for later analysis. It is available for both Windows and Linux and requires (as almost any sniffer) the pcap library. Ethereal is available at www.ethereal.com and you will need libpcap for Linux or WinPcap for Windows.
tcpdump - one of the first sniffing programs. It is a console application that prints info to the screen. The advantage is that it comes by default with most Linux distributions. Windows version is available as well, called WinDump.
ettercap - also a console based sniffer. Uses the ncurses library to provide console GUI. It has built in ARP poisoning capability and supports plugins, which give you the power to modify data on the fly. This makes it very suitable for all kinds of Man-In-The-Middle attacks (MITM), which will we will describe in chapter (FIXME: link). Ettercap isn't that great a sniffer, but nothing prevents you from using its ARP poisoning and plugin features while also running a more powerful sniffer such as ethereal.
Now that you know what a sniffer is and hopefully learned how to use basic functionality of your favorite one, you are all set to gather network data. Let's say you want to know how does a mail client authenticate and fetch messages from the server. Since the protocol in use is POP3, we should instruct ethereal (our sniffer of choice) to capture traffic only destined to port 110 or originating from port 110. If you have a lot of machines checking mail at the same time on a network with a hub, you might want to restrict the matching only to your machine and the server you are connecting to. Here is an example of captured packet in ethereal: Ethereal breaks down the packet for us, showing what each part of the data means. For example, 1 shows us the Ethernet level information, such as source and destination MAC address. Also meaning of each bit in flag values are explained. Looking at the TCP header information, it says that the ... ... ... bits are set and the rest are not. Using packet captures, one can trace the flow of a protocol to better understand how an application works, or even try to reverse engineer the protocol itself if unknown.